What is the Hull Moving Average? A Complete Guide for Traders
Introduction to Hull Moving Average
The Hull Moving Average (HMA) is a technical analysis indicator designed to significantly reduce lag while maintaining smoothness in price action representation. Developed by Alan Hull in 2005, this innovative indicator has gained popularity among traders for its responsiveness to market changes and its ability to generate more timely trading signals compared to traditional moving averages.
Unlike conventional moving averages like the Simple Moving Average (SMA) or Exponential Moving Average (EMA), the Hull Moving Average effectively eliminates lag by using weighted moving averages and a unique square root calculation. This allows traders to identify trend changes more quickly, potentially gaining a valuable edge in fast-moving markets.
How Does the Hull Moving Average Work?
The Hull Moving Average works by addressing the primary drawback of most moving averages – lag. Traditional moving averages often trail behind price movements, causing traders to enter or exit positions too late. The HMA solves this problem through a multi-step process:
- Weighted Moving Averages: It uses Weighted Moving Averages (WMAs) which give more importance to recent prices.
- Speed Adjustment: It creates two WMAs of different periods and subtracts the slower one from the faster one to identify momentum.
- Lag Reduction: It applies a final WMA calculation to a shorter period determined by the square root of the original period.
This process creates an indicator that follows price action closely while filtering out market noise – delivering the best of both worlds for technical analysts and traders.
Hull Moving Average Formula
The HMA formula involves three primary steps:
- Calculate a WMA with period n/2 and multiply it by 2
- Calculate a WMA for the full period n
- Subtract the second result from the first
- Calculate a WMA with period √n on the result
Expressed mathematically:
HMA = WMA(2 × WMA(n/2) - WMA(n)), √n)Where:
- n = the chosen period
- WMA = Weighted Moving Average
- √n = square root of n (rounded to nearest integer)
For example, with a standard 16-period Hull Moving Average:
- Calculate a 8-period WMA (16/2) and multiply by 2
- Calculate a 16-period WMA
- Subtract the 16-period WMA from the doubled 8-period WMA
- Calculate a 4-period WMA (√16) of the resulting values
This complex calculation creates a moving average that is exceptionally responsive while maintaining a smooth line that filters out random price fluctuations.
Why Traders Use Hull Moving Average
Traders increasingly prefer the Hull Moving Average for several compelling reasons:
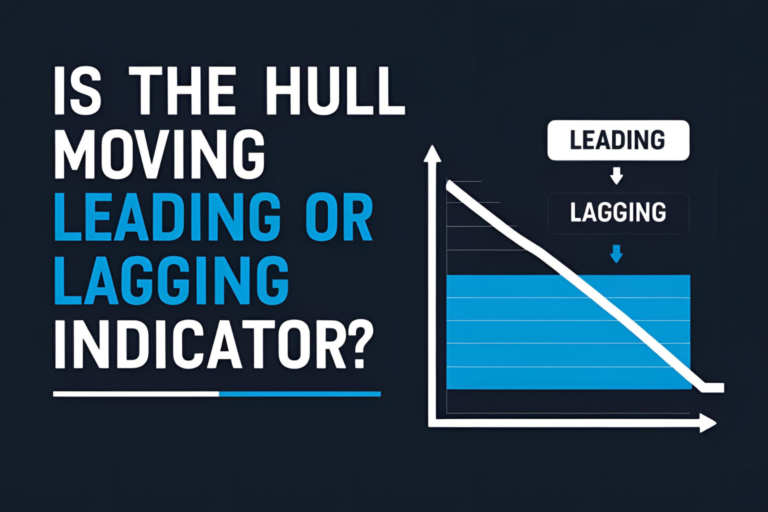
1. Minimal Lag
The most significant advantage of the HMA is its reduced lag compared to traditional moving averages. This allows traders to spot trend changes earlier and make more timely trading decisions.
2. Smooth Signal Line
Despite its responsiveness, the HMA maintains a smooth line that filters out market noise, helping traders distinguish between genuine trend changes and false signals.
3. Clear Trend Direction
The direction of the HMA line provides a straightforward indication of the current trend:
- Rising HMA = Uptrend
- Falling HMA = Downtrend
4. Simplified Chart Analysis
Many traders use the HMA as a standalone indicator, reducing chart clutter and simplifying analysis.
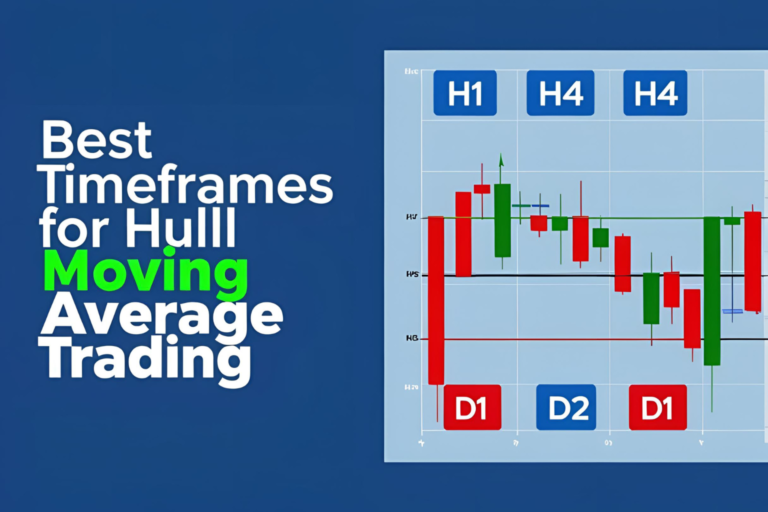
5. Versatility Across Timeframes
The HMA performs well across multiple timeframes, making it suitable for day traders, swing traders, and position traders alike.
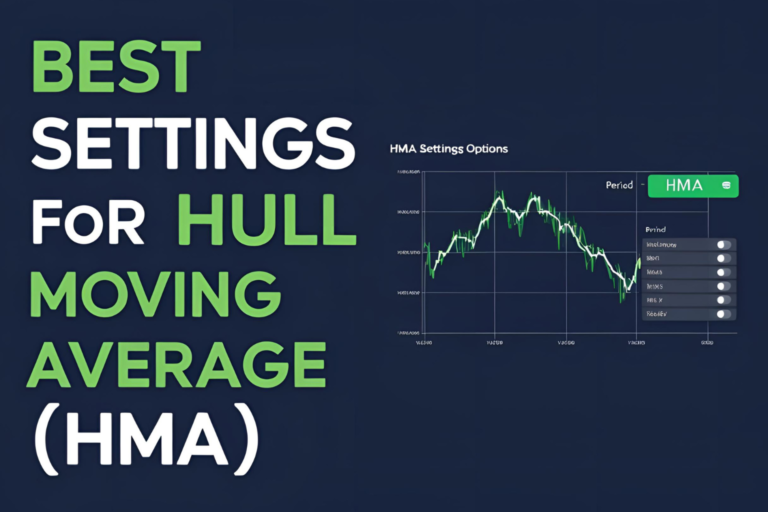
Optimal Hull Moving Average Settings
Finding the optimal Hull Moving Average settings depends on your trading style, market conditions, and time horizon. However, some commonly used settings have proven effective:
Day Trading
- 9-period HMA: Highly responsive for quick intraday moves
- 16-period HMA: Balanced approach for day trading
- 21-period HMA: Slightly more filtering for volatile markets
Swing Trading
- 21-period HMA: Standard setting for swing trades
- 34-period HMA: More stable for medium-term positions
- 55-period HMA: Identifies stronger swing trends
For Position Trading
- 55-period HMA: Captures intermediate trends
- 89-period HMA: Identifies longer-term market direction
- 144-period HMA: For major trend identification
Remember that these are starting points – you should test and adjust these settings based on the specific asset you’re trading and current market conditions.
Hull Moving Average Trading Strategies
1. HMA Trend Following Strategy
The simplest way to use the Hull Moving Average is as a trend filter:
- Buy Signal: When price closes above the HMA and the HMA is sloping upward
- Sell Signal: When price closes below the HMA and the HMA is sloping downward
2. HMA Crossover Strategy
This strategy uses two Hull Moving Averages with different periods:
- Fast HMA: 9-period
- Slow HMA: 21-period
- Buy Signal: When the fast HMA crosses above the slow HMA
- Sell Signal: When the fast HMA crosses below the slow HMA
3. HMA with RSI Strategy
Combining the Hull Moving Average with the Relative Strength Index creates a powerful momentum strategy:
- Buy Signal: When price is above the HMA, HMA is sloping upward, and RSI is above 50
- Sell Signal: When price is below the HMA, HMA is sloping downward, and RSI is below 50
4. HMA Pullback Strategy
This strategy looks for retracements in strong trends:
- Buy Setup: During an uptrend (identified by rising HMA), wait for price to pull back to the HMA
- Buy Trigger: When price bounces off the HMA and starts moving in the trend direction again
- Sell Setup: Apply the same concept in reverse for downtrends
HMA vs. Other Moving Averages
Understanding how the Hull Moving Average compares to other popular moving averages can help you determine when to use each:
1. HMA vs. Simple Moving Average (SMA)
- Responsiveness: HMA is significantly more responsive than SMA
- Lag: HMA has minimal lag; SMA has substantial lag
- Noise Filtering: SMA may better filter extreme volatility
- Use Case: HMA for timely entries/exits; SMA for long-term trend confirmation
2. HMA vs. Exponential Moving Average (EMA)
- Responsiveness: HMA is more responsive than EMA
- Lag: HMA has less lag than EMA
- Calculation Complexity: Both use weighted calculations, but HMA’s is more complex
- Use Case: HMA for quicker signals; EMA as a balance between SMA and HMA
3. HMA vs. Weighted Moving Average (WMA)
- Responsiveness: HMA is more responsive
- Lag Reduction: HMA specifically designed to minimize lag
- Calculation: HMA uses WMA in its formula but enhances it
- Use Case: HMA when timing is critical; WMA for a simpler weighted approach
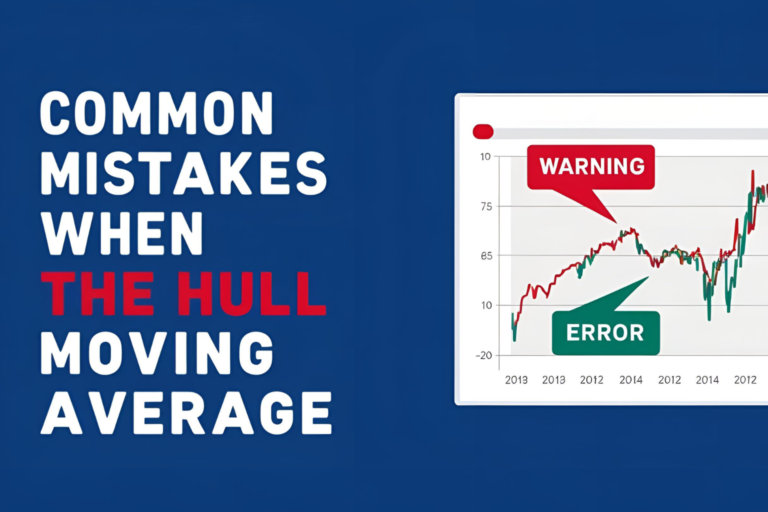
Common Mistakes When Using HMA
1. Ignoring Market Context
The HMA works best when used with an understanding of the broader market environment. Don’t rely solely on HMA signals.
2. Using Inappropriate Period Settings
Using too short a period in volatile markets can generate false signals, while too long a period defeats the purpose of HMA’s responsiveness.
3. Neglecting Confirmation
While the HMA reduces lag, it’s still wise to seek confirmation from other indicators or price action patterns.
4. Overlooking Different Timeframes
Always check multiple timeframes when using the HMA to ensure your signals align with the bigger picture.
5. Expecting Perfect Signals
No indicator is foolproof – even the HMA will generate occasional false signals, especially in ranging or highly volatile markets.
Setting Up Hull Moving Average on Popular Platforms
TradingView
- Open your chart
- Click on “Indicators”
- Search for “Hull Moving Average”
- Adjust settings as needed (period, source, color)
MetaTrader 4/5
- Click “Insert” → “Indicators” → “Custom”
- Select “Hull Moving Average” (may need to be downloaded/installed first)
- Adjust parameters according to your strategy
NinjaTrader
- Right-click on chart → “Indicators”
- Search for “Hull” or “Hull Moving Average”
- Configure settings and click “OK”
StockCharts
- Enter symbol and click “Chart”
- Select “Advanced Chart”
- Click “Indicators” and search for “Hull”
- Set parameters and apply
FAQs
What is the best setting for Hull Moving Average?
The optimal setting depends on your trading style and timeframe. For day trading, a 9 or 16-period HMA often works well. For swing trading, consider 21 or 34-period settings. Always test different settings on your specific instruments.
Is Hull Moving Average better than EMA?
The Hull Moving Average typically responds faster to price changes than an EMA while maintaining smoothness. However, “better” depends on your trading objectives. The HMA excels for timing entries and exits, while the EMA may be preferred for general trend identification.
Can Hull Moving Average be used for cryptocurrency trading?
Yes, the Hull Moving Average works well in cryptocurrency markets, particularly for identifying trend changes in these volatile markets. Many crypto traders use shorter period settings (9-16) due to the market’s rapid movements.
Does Hull Moving Average work in ranging markets?
The HMA is primarily a trend-following indicator and may generate false signals in sideways markets. During ranging conditions, consider combining the HMA with oscillators like RSI or Stochastic to filter signals.
How can I reduce false signals when using Hull Moving Average?
To minimize false signals:
- Use appropriate period settings for your timeframe
- Combine with volume indicators to confirm strength
- Wait for confirmation candles after crossovers
- Apply additional filters like support/resistance or market structure
The Hull Moving Average represents one of the most significant innovations in technical analysis indicators in recent years. By dramatically reducing lag while maintaining signal quality, it offers traders a powerful tool for identifying trends and timing entries and exits with greater precision.
Whether you’re a day trader seeking quick signals or a swing trader looking for a more responsive trend indicator, the Hull Moving Average deserves a place in your technical analysis toolkit. As with any indicator, success comes from thorough testing, proper implementation, and integration with a comprehensive trading plan.
Ready to take your trading to the next level? Explore our other articles on advanced HMA strategies and optimal settings for different market conditions.