Common Mistakes When Using the Hull Moving Average
The Hull Moving Average (HMA) is known for its smoothness and responsiveness, making it a favorite among traders. However, like any technical indicator, its effectiveness depends on how you use it. Many traders make avoidable errors that reduce the HMA’s reliability. This article highlights the most common mistakes when using the Hull Moving Average — and how to avoid them.
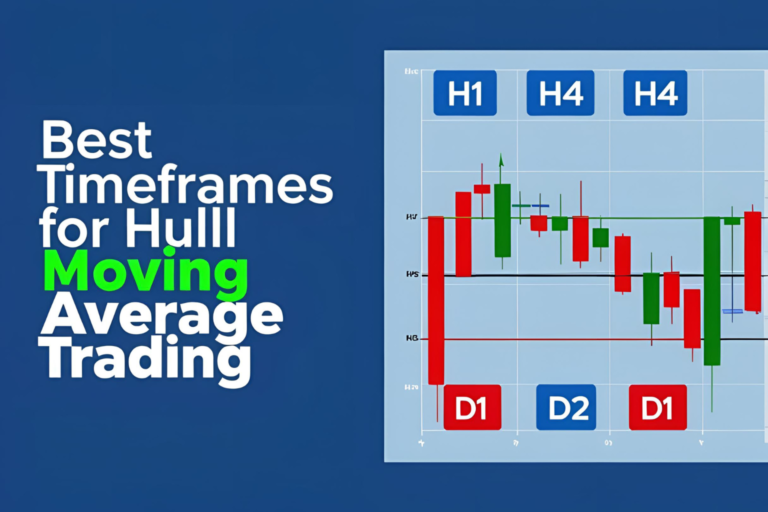
1. Using the Same Settings Across All Timeframes
The HMA performs differently depending on the timeframe. A 21-period HMA may work on a 15-minute chart but lag on a daily chart.
✅ Fix: Adjust the period to match your timeframe:
- Lower timeframes: 9–21
- Higher timeframes: 55–144
2. Relying on HMA Alone
While HMA offers clean trend signals, no single indicator should be used in isolation.
✅ Fix: Combine HMA with:
3. Ignoring Market Conditions
In ranging or sideways markets, HMA signals can produce false crossovers and lead to poor entries.
✅ Fix: Use HMA only in trending markets. Apply ADX or Choppiness Index to filter low-trend environments.
4. Overtrading Every HMA Crossover
Not all crossovers are reliable. Some may occur due to volatility or short-term price spikes.
✅ Fix: Wait for confirmation — look for slope alignment, support/resistance zones, or a second indicator agreement.
5. Using HMA on Illiquid or Thinly Traded Assets
Low-volume assets often show erratic price moves, leading to misleading HMA signals.
✅ Fix: Apply HMA on highly liquid instruments like major forex pairs, large-cap stocks, or top cryptos.
6. Ignoring Slope Direction
Many traders focus only on price crossing the HMA but forget to check the slope. A flat or downward-sloping HMA during a buy signal may result in a false trade.
✅ Fix: Only trade in the direction of the HMA slope. Avoid entries if the line is flat or curling against your bias.
7. Using Too Many HMAs on One Chart
Some traders apply multiple HMAs without clarity, leading to confusing signals.
✅ Fix: Limit to one or two HMAs per chart (e.g., 21 & 55) for crossover or support/resistance strategies.
Conclusion
The Hull Moving Average is a reliable trend indicator — but it’s only as good as your execution. Avoid these common mistakes to unlock its full potential and trade more confidently. Remember, indicators are tools, not magic signals. Use them wisely and with discipline.
FAQs
1. Is HMA reliable in all markets?
It performs best in trending markets. Avoid using it in sideways conditions.
2. How do I reduce false signals from HMA?
Combine HMA with a momentum indicator or volume analysis.
3. Should I change HMA settings for crypto trading?
Yes, crypto volatility may require faster settings (e.g., 9 or 15).
4. Can I use HMA for scalping?
Absolutely, but use low periods (9–12) and quick confirmation strategies.
5. What’s a good indicator to pair with HMA?
RSI, MACD, and volume-based indicators are great companions for HMA.